Pie Charts(Reasoning Aptitude > Data Interpretation ) Questions and Answers

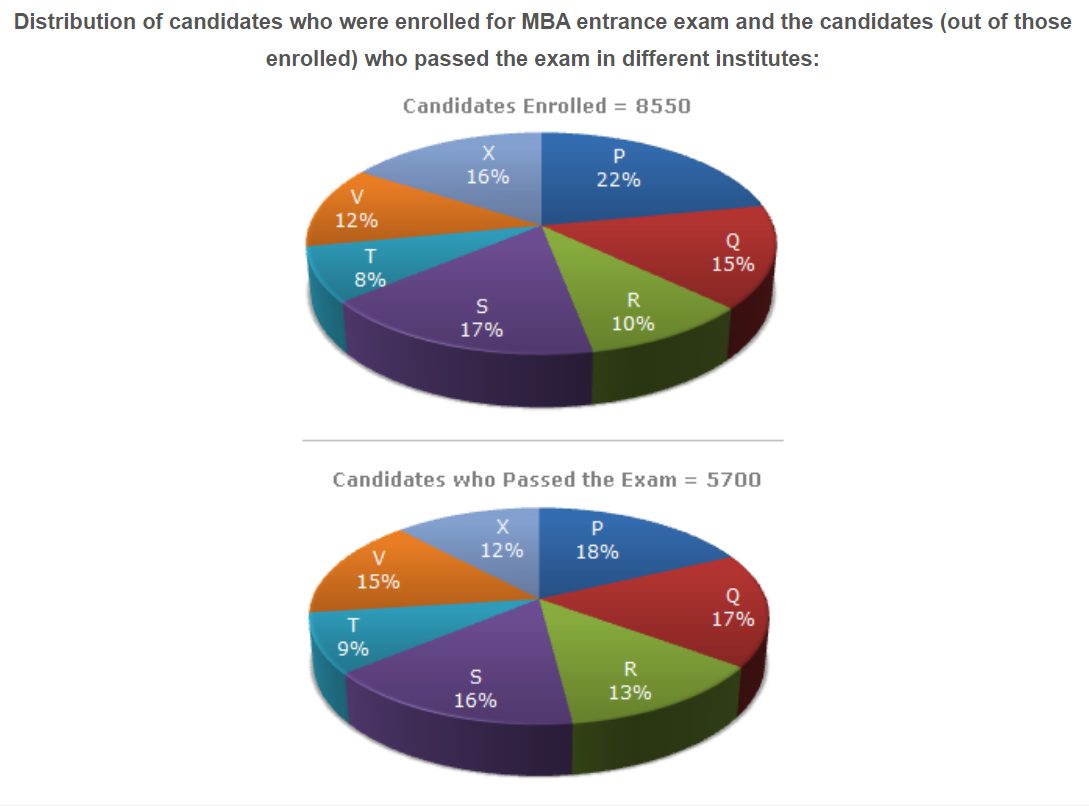
Question 1. Study the following graph carefully and answer the questions given below: The Number Of Candidates Passed From Institutes S And P Toge...
The number of candidates passed from institutes S and P together exceeds the number of candidates enrolled from institutes T and R together by:
  1.    228
  2.    279
  3.    399
  4.    407
Explanation:-
Answer: Option C. -> 399
Answer: (c).399

Question 2. Study the following graph carefully and answer the questions given below: What Is The Ratio Of Candidates Passed To The Candidates Enr...
What is the ratio of candidates passed to the candidates enrolled from institute P?
  1.    9 : 11
  2.    14 : 17
  3.    6 : 11
  4.    9 : 17
Explanation:-
Answer: Option C. -> 6 : 11
Answer: (c).6 : 11

Question 3. Study the following graph carefully and answer the questions given below: What Is The Percentage Of Candidates Passed To The Candidate...
What is the percentage of candidates passed to the candidates enrolled for institutes Q and R together?
  1.    68%
  2.    80%
  3.    74%
  4.    65%
Explanation:-
Answer: Option B. -> 80%
Answer: (b).80%

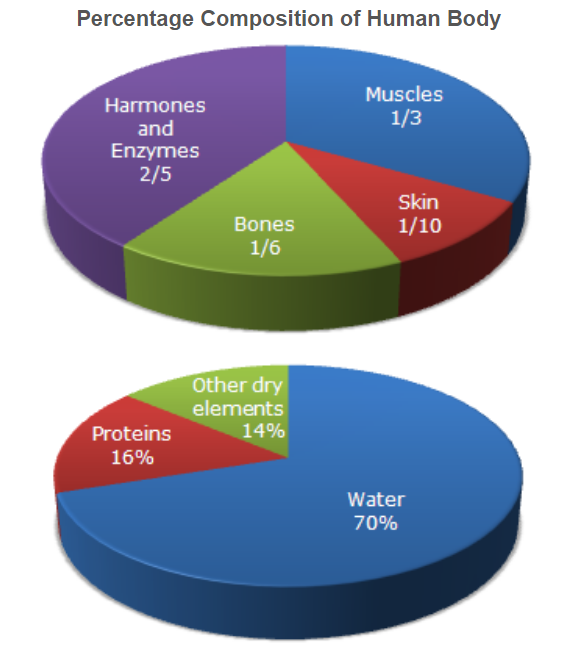
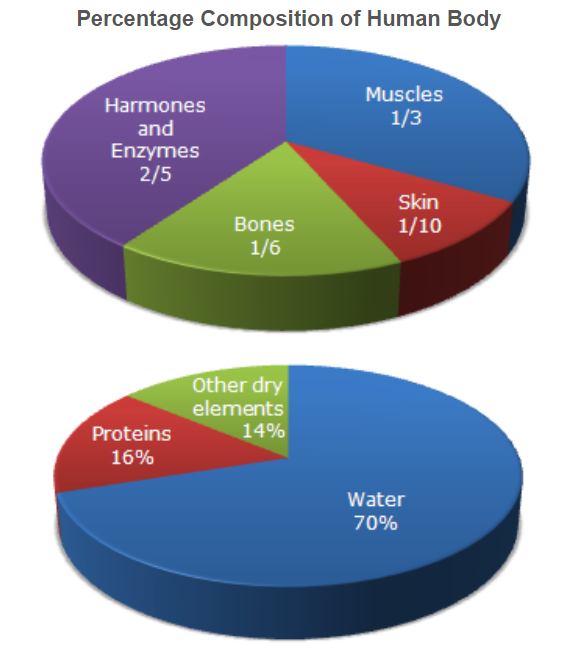
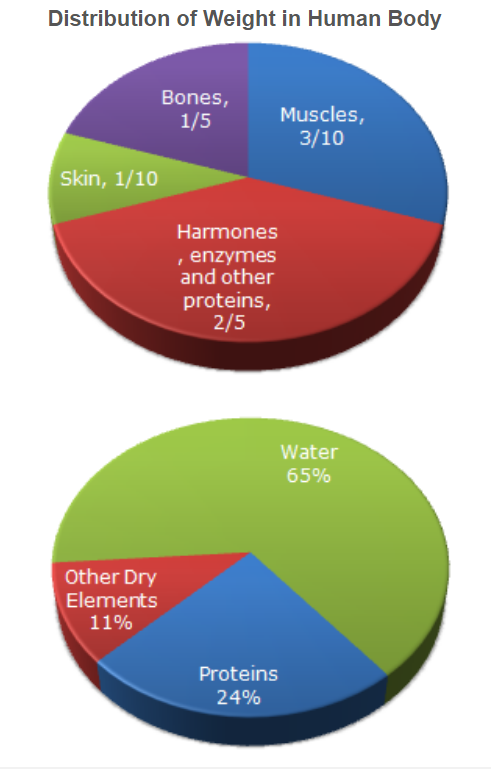
Question 4. Study the pie-diagrams carefully and answer the following question.
What percent of the total weight of human body is equivalent to the weight of the proteins in skin in human body?Study The Pie-diagrams Carefully And Answer The Following Qu...
  1.    0.016
  2.    1.6
  3.    0.16
  4.    Data inadequate
Explanation:-
Answer: Option B. -> 1.6
Answer: (b).1.6

Question 5. Study the pie-diagrams carefully and answer the following question.
What will be the quantity of water in the body of a person weighing 50 kg?Study The Pie-diagrams Carefully And Answer The Following Qu...
  1.    20 kg
  2.    35 kg
  3.    41 kg
  4.    42.5 kg
Explanation:-
Answer: Option B. -> 35 kg
Answer: (b).35 kg

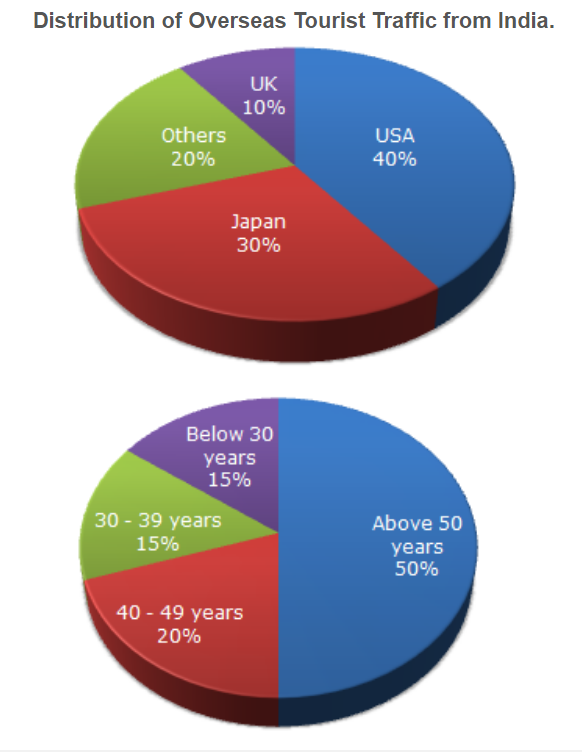
Question 6. The following pie charts exhibit the distribution of the overseas tourist traffic from India. The two charts shows the tourist distribution by country and the age profiles of the tourists respectively.
The ratio of the number of Indian tourists that went to USA to the number of Indian tourists who were below 30 years of age is ?The Following Pie Charts Exhibit The Distribution Of The Ove...
  1.    2:1
  2.    8:3
  3.    3:8
  4.    Cannot be determined
Explanation:-
Answer: Option B. -> 8:3
Answer: (b).8:3

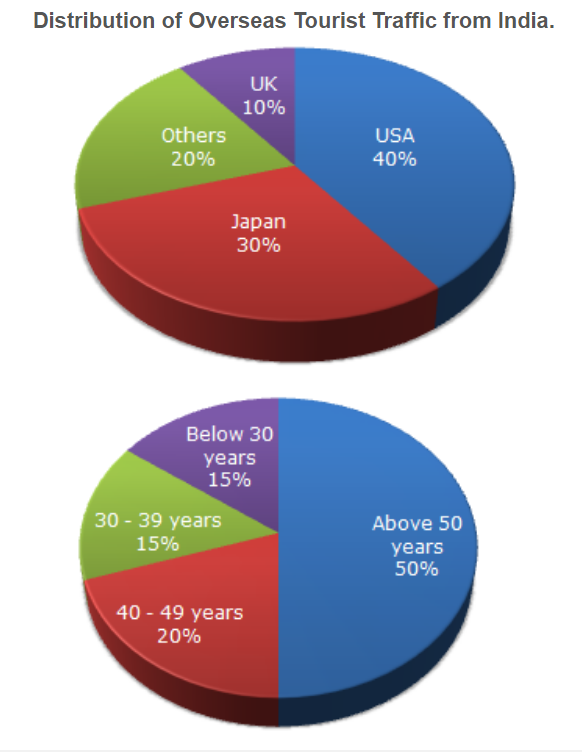
Question 7. The following pie charts exhibit the distribution of the overseas tourist traffic from India. The two charts shows the tourist distribution by country and the age profiles of the tourists respectively.
If amongst other countries, Switzerland accounted for 25% of the Indian tourist traffic, and it is known from official Swiss records that a total of 25 lakh Indian tourists had gone to Switzerland during the year, then find the number of 30-39 year old Indian tourists who went abroad in that year ?The Following Pie Charts Exhibit The Distribution Of The Ove...
  1.    18.75 lakh
  2.    25 lakh
  3.    50 lakh
  4.    75 lakh
Explanation:-
Answer: Option D. -> 75 lakh
Answer: (d).75 lakh

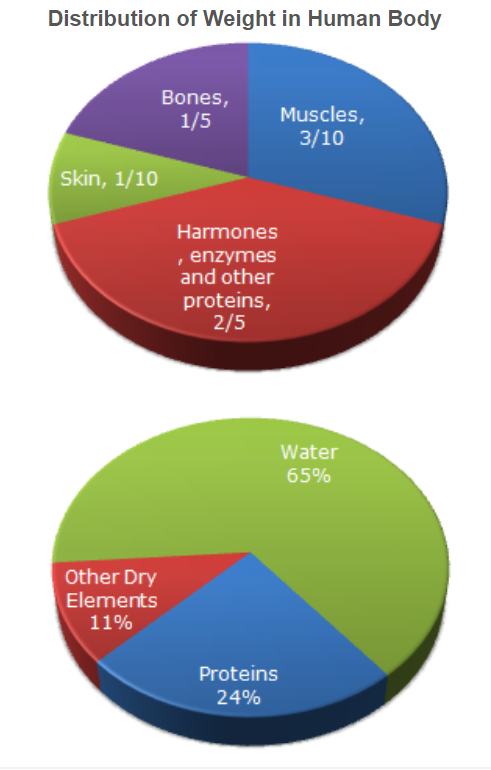
Question 8. The following pie chart give the information about the distribution of weight in the human body according to different kinds of components. Study the pie charts and answer the question.
What percentage of proteins of the human body is equivalent to the weight of its skin ?The Following Pie Chart Give The Information About The Distr...
  1.    41.66 %
  2.    43.33 %
  3.    44.44 %
  4.    Cannot be determined
Explanation:-
Answer: Option A. -> 41.66 %
Answer: (a).41.66 %

Question 9. The following pie chart give the information about the distribution of weight in the human body according to different kinds of components. Study the pie charts and answer the question.
How much of the human body is neither made of bones or skin ?The Following Pie Chart Give The Information About The Distr...
  1.    40 %
  2.    50 %
  3.    60 %
  4.    70 %
Explanation:-
Answer: Option D. -> 70 %
Answer: (d).70 %

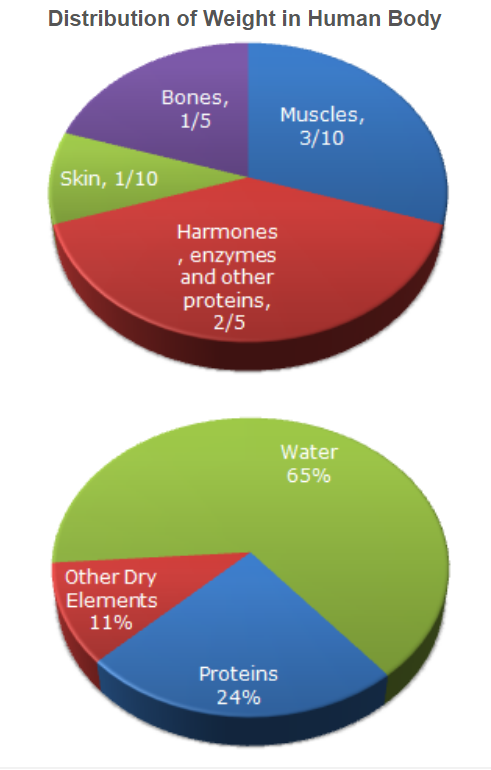
Question 10. The following pie chart give the information about the distribution of weight in the human body according to different kinds of components. Study the pie charts and answer the question.
What is the ratio of the distribution of proteins in the muscles to that of the distribution of proteins in the bones ?The Following Pie Chart Give The Information About The Distr...
  1.    2:1
  2.    2:3
  3.    3:2
  4.    Cannot be determined
Explanation:-
Answer: Option D. -> Cannot be determined
Answer: (d).Cannot be determined